
Fundamental Concepts of Pullback
The pullback is a key concept if you are in the trading world. When you understand well how it works, it can help you significantly improve your results. Therefore, in this mini-guide, we will explain in detail and briefly what a pullback is, how to identify it, strategies to operate it, and its application in different markets.
Definition and meaning in trading
A pullback is a temporary movement in the price of an asset that moves in the opposite direction to what was expected, that is, against the prevailing trend. This retracement is often an excellent opportunity for those looking to enter the market at a more favorable price.
For example: If an asset is in an uptrend and suddenly there is a price drop (pullback), a possible buying entry opens, and perhaps, after that retracement, it continues with its upward advance.
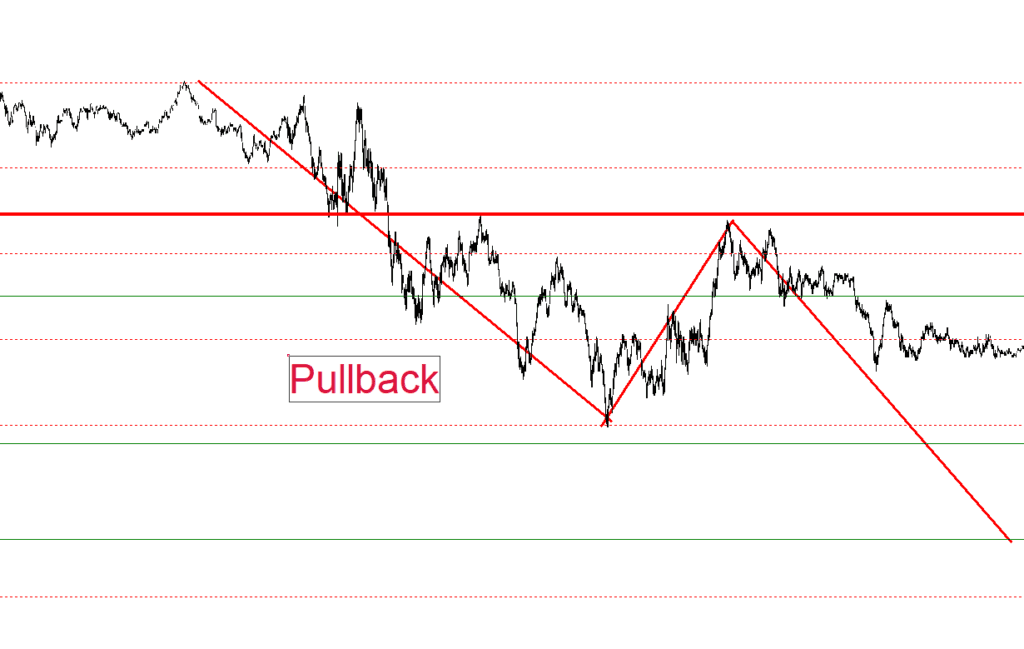
Differences between Pullback and Throwback
Pullback: Occurs in an uptrend.
Throwback: Happens in a downtrend.
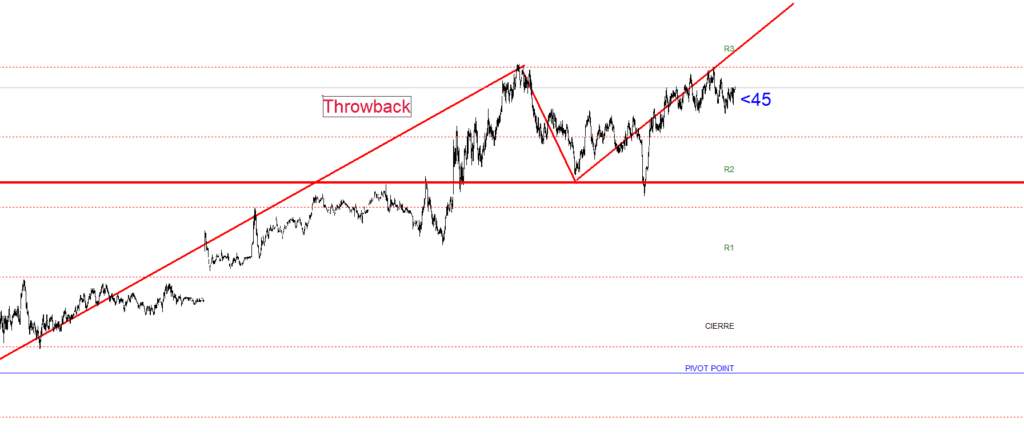
Both concepts are key to understanding market movements although they apply in different contexts.
Most Common Types of Pullback
Bull Market Pullback: When the price retraces in an ascending trend.
Bear Market Pullback: When a small rebound occurs in a descending trend.
Bottom Pullback: A retracement that occurs after a significant trend change.
Continuation Pullback: When the original trend resumes after the retracement.
How to Identify an Effective Pullback
Key characteristics of a valid pullback
To identify a pullback, consider the following characteristics:
Clear trend: It must originate from an established and clear trend before the retracement.
Moderate retracement: The retracement should not exceed 50% of the previous movement.
Support point: The retracement stops at key levels such as Fibonacci retracements, moving averages, or trend lines.
Volume: During the pullback, low volume indicates a loss of strength, and an increase in volume at the end suggests recovery.
Reversal patterns: Look for patterns like doji or hammer that suggest the end of the retracement.
Smooth retracement: Indicates that the main trend remains strong.
Reasonable duration: The pullback should not be confused with a trend reversal.
Technical confirmation signals
Reversal candlestick patterns: Doji or hammer.
Support at key levels: Fibonacci retracements, moving averages, or trend lines.
Volume: Increase at the end of the pullback.
Technical indicators: RSI, MACD, or stochastic.
Breakout: Surpassing key levels after the retracement.
Complex Pullback: what it is and how to recognize it
A complex pullback is a retracement with several movements and greater volatility. Characteristics:
Multiple movements and varied directions.
Longer duration.
Complex patterns and uncertainty.
Trading Strategies with Pullback
Steps to trade with pullbacks
Identify the main trend.
Wait and locate the pullback.
Look for key levels such as supports or resistances.
Confirm the pullback with technical signals.
Set the entry point.
Manage risk with stop-loss and take-profit.
Monitor and adjust as necessary.
Risk management in pullback operations
Do not risk more than 2% of the capital per trade.
Use stop losses to protect the investment.
Common mistakes to avoid
Not waiting for confirmation.
Trading against the main trend.
Ignoring risk management.
Over-trading in high volatility.
The Pullback in Different Markets
Pullback in the stock market
Pullbacks are common and traders identify support and resistance levels to enter the market.
Application in Forex
With high volatility and liquidity, pullbacks offer opportunities in currency movements.
Use in cryptocurrency markets
In cryptocurrencies, risk management is critical due to their high volatility and uncertainty.
Practical Analysis of Pullback
Real examples of operations
Example: An asset rises to $100, retraces to $90, and then advances to $110. The retracement to $90 could be considered a valid pullback if the previously explained conditions are met.
How to determine the end of a pullback
Useful tools:
Candlestick patterns: Doji, hammer, engulfing.
Key levels: Fibonacci retracements, supports, moving averages.
Volume: Increase at the end of the pullback.
Combination with other technical indicators
RSI: Signals in oversold or overbought areas.
MACD: Signal line crossings.
Stochastic: Indications of leaving extreme zones.
Price action: Observation of candlesticks and key level breakouts.
Frequently Asked Questions about Pullback
Difference between pullback and retracement
The retracement is any movement against the trend, while the pullback is a temporary correction in an established trend.
Pullback system vs other strategies
The pullback system focuses on taking advantage of retracements within a trend, unlike strategies such as breakout trading or performance trading.
Recommended timeframes to trade pullbacks
1 hour: For short-term movements.
4 hours: For more significant pullbacks.
1 day (daily): Medium-term approach.
In short, understanding how a pullback works can be very beneficial in any market, whether stocks, Forex, or cryptocurrencies, as long as it is managed properly.


