
What are technical patterns in trading?
Technical patterns are key tools to perform the necessary technical analysis for trading in the markets.
These patterns are based on the study of past price and volume behavior of an asset to predict future movements. When these patterns are recognized graphically, it is much easier and allows making decisions more securely and effectively.
Main types of technical patterns
Reversal patterns
Reversal patterns indicate an imminent change in the price direction, that is, they indicate a change from a bullish to bearish trend or vice versa. This type of pattern is useful for traders to identify entry or exit points in the market.
Bullish reversal patterns
These patterns indicate a change from a bearish to a bullish trend, that is, a bullish reversal pattern can be:
Double Bottom: Two consecutive lows at similar levels.
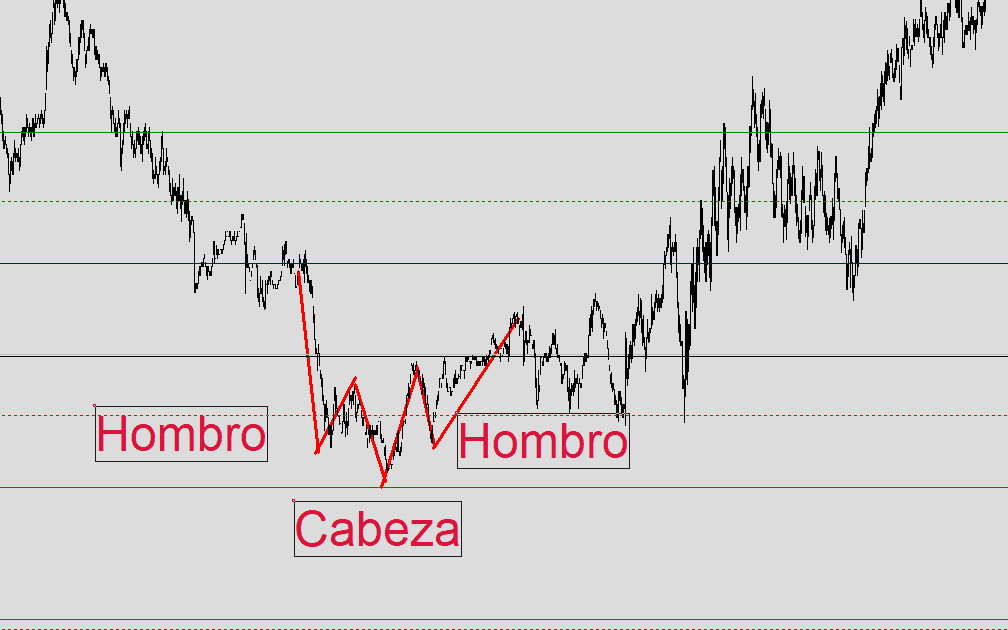
Inverse Head and Shoulders: Three lows, with the central one lower than the others.
Bullish Engulfing Candle: A large bullish candle engulfs a bearish candle.
Bullish Pin Bar: Candle with a long lower wick, indicating rejection of low prices.
Bearish reversal patterns
These patterns indicate a change from a bullish to a bearish trend:
Double Top: Two consecutive highs at similar levels.
Head and Shoulders: Three highs, with the central one higher than the others.
Bearish Engulfing Candle: A large bearish candle engulfs a bullish candle.
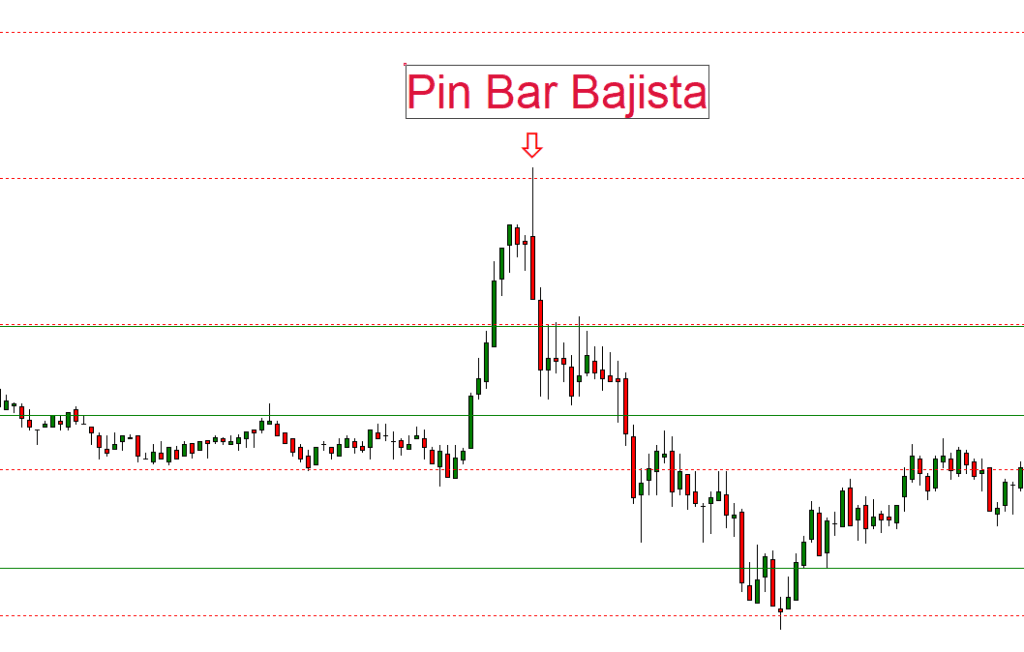
Bearish Pin Bar: Candle with a long upper wick, indicating rejection of high prices.
Continuation patterns
Continuation patterns—as the name suggests—suggest that the market's current trend will continue in the same direction after a pause. These patterns can help traders maintain their position during a trend. Examples of such patterns include flags and triangles, which indicate that after a pause, the price will continue its original trajectory.
Bilateral patterns
Bilateral patterns are those that do not indicate a clear price direction. Therefore, it is usual for the trader to prepare in anticipation of a breakout in one of the directions (up or down) before making a decision using entry orders (buy stop or sell stop) at each end of the pattern. Examples of such patterns include:
Symmetrical Triangle with descending highs and ascending lows converging.
Rectangle (side range) where the price moves horizontally between support and resistance.
Wedge: Price movement in a narrow range, sloping up or down.
The most effective patterns for trading
Double top and double bottom
The double top pattern is a bearish reversal signal formed after a bullish trend, while the double bottom is the opposite and indicates a bullish reversal after a bearish trend. Both patterns are very significant and easy to identify visually, making them frequently used in technical analysis. However, they may present false signals that cause confusion, so it is always necessary to confirm the pattern as trading or making decisions without confirmation can lead to errors. The price could simply consolidate or continue with the trend prior to the pattern.
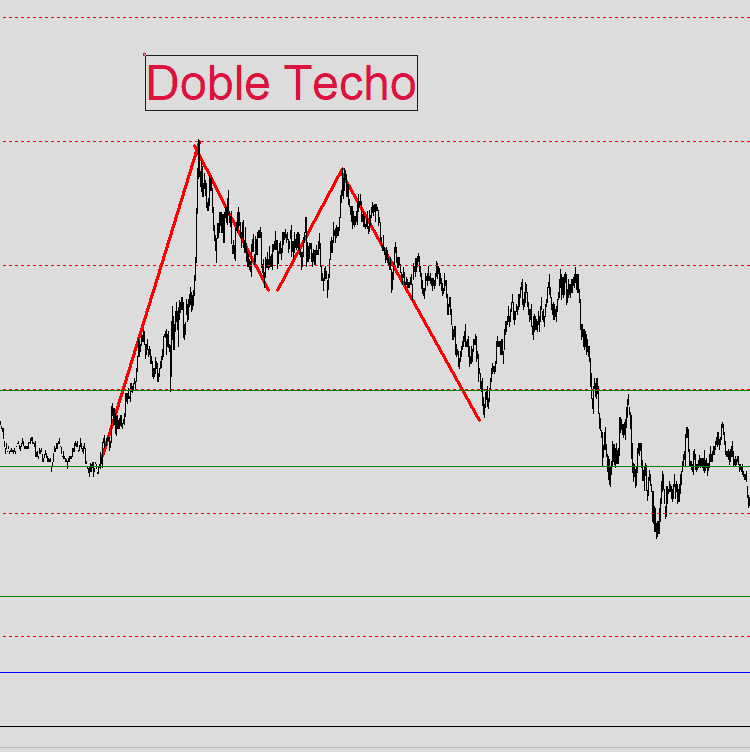
The shape of the double top pattern is two consecutive peaks at similar levels, separated by a valley. This pattern indicates that the price fails to overcome a significant resistance twice.
The double bottom pattern has a similar shape but reversed; that is, two consecutive lows at similar levels separated by an intermediate peak, indicating that the price fails to break a key support twice.
Head and shoulders
This pattern is another of the most recognized and visually easy to identify in technical analysis. The head and shoulders pattern indicates a possible trend reversal (a bearish reversal appearing after a bullish trend, indicating a change to a bearish trend) and is shown with a figure of three peaks: two shoulders and one head. Its inverse, the inverted head and shoulders pattern, is also effective for identifying changes in market direction.
Triangles (ascending, descending, symmetrical)
Triangles are continuation patterns that can be ascending or descending (indicating a bullish or bearish trend) or symmetrical. These patterns form during periods of consolidation, and their breakout can indicate the beginning of a new trend movement. However, as mentioned earlier, some triangles can also act as bilateral patterns.
Flags and pennants
Flags and pennants are continuation patterns that appear after a significant price movement. Their formation indicates a temporary pause before the original trend resumes.
The flag pattern can be recognized because it forms a kind of slanted rectangle channel against the main trend, consisting of:
An initial phase: Strong and fast movement in one direction forming a “flagpole.”
Consolidation phase: The price moves in a narrow range against the main trend. Support and resistance lines are parallel and often have a slight inclination.
On the other hand, the pennant is characterized by a consolidation in the form of a small symmetrical triangle, also composed of a “flagpole” (strong and fast movement in the main trend) and the pennant that is shown as the price contraction with converging lines (support and resistance) indicating trend continuation after the breakout.
Candlestick patterns
The 60 fundamental patterns
Japanese candlesticks are a popular way to represent price movement on charts. They are patterns that visually represent price fluctuations over a period of time. There are approximately 60 patterns that can help predict the market's direction. Learning to interpret them is not easy and requires practice and experience, but once you know how to do it—despite always needing confirmation with other indicators—can be very useful in decision-making.
Most reliable reversal patterns
Japanese candlestick patterns show how buyers and sellers interact at a specific moment in the market.
Among the most reliable candlestick patterns are hammer, engulfing, and doji. These are considered more reliable because they are patterns that visually (candles) show how buyers and sellers feel at that specific moment in the market. Each of these patterns has unique characteristics to indicate a possible trend reversal.
For example, the hammer pattern: Suppose the price has been falling for a while, and a candle pattern called “hammer” appears. This pattern may indicate that sellers were pushing the price down, but by the end of the day, buyers managed to push the price back up. The information provided by this pattern is that buyers are taking control, and the market sentiment is changing from negative to positive, which could be interpreted as a sign that the price will rise.
Signal interpretation
It is important to know that the interpretation of signals generated by Japanese candlestick patterns can be subjective, and precisely because of this, interpretation should be combined with other technical indicators to confirm the interpretation.
How to identify and operate with patterns
Pattern confirmation
Confirmation is essential before trading a technical pattern. A trader must wait for the price to break a key level or for an increase in volume to validate the identified pattern and reduce the risk of false signals.
Risk management
As you suppose, having good risk management is crucial for trading. You should set appropriate stop-loss levels and calculate your position sizes to protect your capital. Remember that good risk management can make the difference between success and failure in trading.
Price objectives
Once you have identified the pattern and confirmed its validity, it’s important to set price objectives. These objectives can be calculated using different methods, such as projecting the pattern's height or nearby support and resistance levels.
Technical patterns in different markets
Patterns in Forex
In the Forex market, technical patterns can be especially useful due to currency volatility and can be very helpful to identify entry and exit points based on price action and market sentiment.
The main patterns in the Forex market are:
Reversal Patterns:
Double Top: After a bullish trend, the price rises, falls back, and then tries to rise again without succeeding, indicating a bearish reversal.
Double Bottom: After a bearish trend, the price reaches a low, rebounds and falls to the same level without going lower, indicating a bullish reversal when the resistance is broken.
Head and Shoulders: This pattern forms in a bullish trend. You can identify it as three peaks (shoulder, head, shoulder) and a break of support (the support is an imaginary line connecting the low points between the three peaks) shown when the price breaks this line downwards, often indicating a bearish reversal.
Inverse Head and Shoulders: This pattern forms in a bearish trend and is the opposite of the previous one, as it usually indicates a bullish reversal when the price breaks the resistance, meaning when the asset price manages to surpass a key level where it previously struggled to rise.
Continuation Patterns:
Ascending Triangle: You recognize it as a pause occurring during a price hike. The price rises, but each time it tries to go down, it doesn't manage or at least not as before, and an ascending line forms from below up to a “barrier” that it doesn't manage to surpass. When the price finally surpasses that “barrier” (the resistance), it often indicates an upward trend likely to continue.
Descending Triangle: Appears in a bearish trend, opposite to the previous point, so breaking the support suggests the bearish trend will continue.
Flag: First, the price rises or falls rapidly (this is the «flagpole»), followed by a brief pause and the price moving within a narrow range but contrary to the main movement, as if taking a breath, giving it the shape of a «flag». When the price ends this pause and breaks that range, it tends to return in the same direction as before, either upward or downward. It’s like taking a pause while running or walking to catch your breath and continue!
Pennant: Similar to the flag, first, the price makes a strong move, then stops a bit and starts forming a small triangle (the pennant) while “resting”. When the price manages to break that triangle, it usually returns in the direction it initially had.
Patterns in stocks
As with the rest, in the stock market, technical patterns greatly aid in identifying opportunities based on market trends and observed patterns. The market often features patterns like the double top and head and shoulders, which, as seen earlier, indicate possible trend reversals, signaling that an upward trend may turn downward or vice versa.
Patterns in futures
In futures markets, technical patterns likewise help anticipate asset price movements, such as commodities and bonds, so it’s crucial to identify patterns to minimize risks and increase the chances of successful trades.
Common mistakes in pattern trading
False breakouts
A common mistake is trading based on false breakouts, where the price appears to break a key level but quickly returns to the previous trend. Therefore, we cannot stress enough that before making a decision, confirm what the pattern shows with other tools like technical indicators (RSI, MACD), trading volumes, etc., to ensure the breakout is real.
Volume confirmation
Remember never to ignore volume. Trading solely on pattern information can lead to erroneous decisions. An increase in volume during a pattern breakout offers greater confidence that the perceived movement is correct.
Emotional management
Emotional management is vital in trading. Avoid being driven by emotions and acting impulsively if you want to achieve good results. Remember that maintaining discipline and adhering to a well-defined trading plan is crucial for achieving good trading results. Despite this, it’s a skill gained over time and practice, so don’t give up if, initially or during early attempts, things don’t go as planned. Instead, focus on training and improving your skills.


