
In the world of trading, it is imperative to stay alert to price changes and developments, which is why Japanese candlestick patterns have become a strategic tool for financial analysis and determining the correct direction of asset prices.
This time, we bring you the most relevant points of Japanese candlestick patterns, offering you a guide that provides a foundation to help you perform effective technical analysis and easily understand this important aspect of trading.
What are Japanese candlestick patterns?
Japanese candlestick patterns are a graphical representation used to clearly visualize what is happening at a given moment with asset prices.
In other words, Japanese candlestick patterns allow you to graphically analyze the evolution of an asset, enabling you to anticipate what will happen, considering that each candlestick represents the price in the financial market.
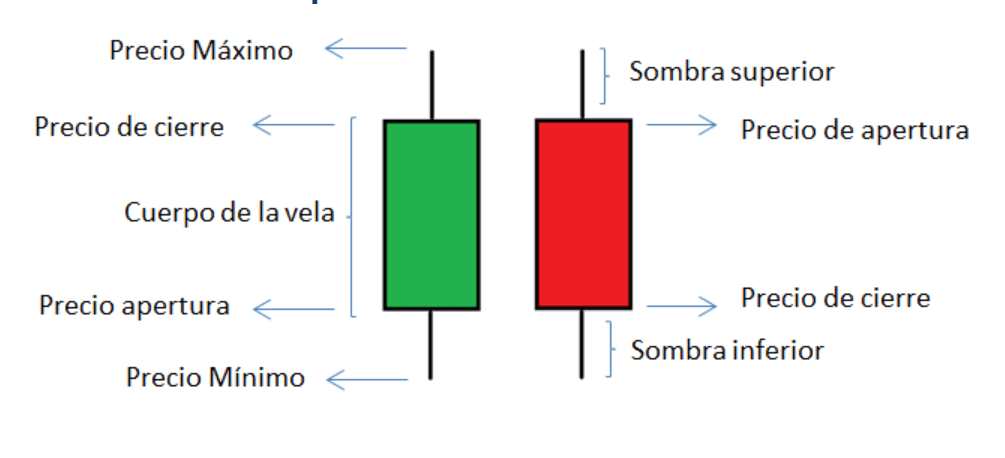
Anatomy of a Japanese Candle
Unlocking insights from your data requires the ability to query it effectively. Flexify goes beyond the basics by offering support for custom queries. Whether you're performing advanced joins or implementing server-side filtering, Flexify's custom query capabilities empower you to derive meaningful insights from your data.
Meaning of Colors and Shadows
Due to their structure and characteristics, Japanese candlesticks will give you a better interpretation of the direction of financial trends. The relevance of this type of chart is that they indicate price movement information through the body, color, and shadows.
The Color
The color of the candle will indicate whether we are facing an upward or downward trend, which translates into being able to analyze whether the asset's price is increasing or decreasing based on the color of the candle.
An upward trend candle is represented by the color green and, on some analytical platforms, may be shown in white, while bearish candles are represented in red or black. However, there are now platforms that allow you to customize the color.
The Shadows
The length of the shadows provides valuable information for technical analysis, where a shadow or wick indicates the minimum and maximum prices at the moment, and their length can determine the market's volatility level.
Thus, we can say that by observing the upper shadow of the candle, we can easily visualize the maximum price reached at a given time, as well as the minimum price by observing the lower shadow.
Basic Types of Candles
The basic patterns of Japanese candles we find are:
Bullish Candlestick Pattern: This pattern indicates that the trend will change and that the asset price is increasing.
Bearish Candlestick Pattern: In contrast to the bullish trend, this pattern indicates a market decline.
Continuation Pattern: This pattern indicates that the current trend will continuously persist.
48 Fundamental Candlestick Patterns
If you want to stand out on the stock market and make the best financial decisions, it's important to learn to recognize Japanese candlestick patterns. And yes, there are more than 40 patterns at your disposal to achieve the best trading strategy.
Here are some to help you familiarize yourself, but don't worry, with this guidance and your common sense, progressing positively in the financial market will be an easy task.
Single Candle Patterns
It is a candle pattern characterized by being composed of a single candle. An example of this type of pattern is the inverted hammer.
Double Candle Patterns
This Japanese candle pattern presents itself with two consecutive candles, such as the bullish engulfing pattern.
Triple Candle Patterns
As its name suggests, this pattern consists of a sequence of three candles, which in this case, are responsible for announcing the market trend. An example is the three white soldiers pattern.
Bullish Trend Reversal Patterns
Hammer and Inverted Hammer
The hammer is represented with a short upper body and a long lower wick, this individual pattern indicates that an upward trend is approaching.
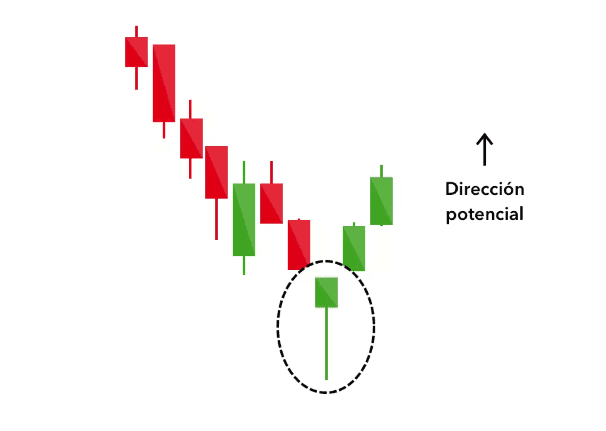
The inverted hammer pattern is presented with a candle that has a short body at the bottom and a long wick at the top, and this pattern forms during a downtrend.
Bullish Engulfing
This pattern is composed of two candles, where a bearish candle is visualized alongside a larger bullish candle that aims to engulf it, which is interpreted as the low closing prices giving way to an upward trend. This pattern forms in a downtrend.
Morning Star
This pattern of three consecutive candles emerges at the end of a downtrend. This pattern stands out because the first candle is bearish, and the second is bearish but small in size, denoting market indecision, yet highlights the third bullish candle, indicating a positive change in prices.
Bearish Trend Reversal Patterns
Shooting Star
This pattern shows a small candle at the bottom and a long upper wick. The shooting star occurs during an uptrend, where its long wick reflects the attempt to increase the price, and in contrast, the body size towards the bottom indicates that the attempt is unsuccessful and the price will fall.
Bearish Engulfing
This pattern is composed of two candles, where a bullish candle is visualized alongside a larger bearish candle that seeks to engulf the bullish candle, indicating that the high closing prices will shift towards a bearish trend. This pattern forms in an uptrend.
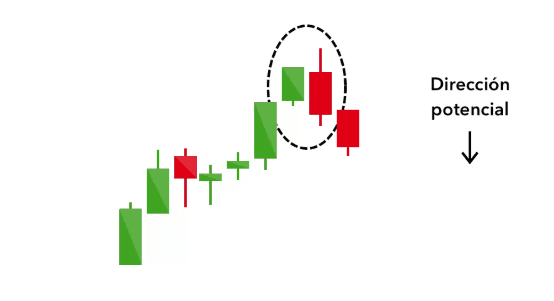
From this orientation, you can now analyze other bearish trend reversal patterns, such as the three black crows and the hanging man pattern.
Continuation Patterns
After reviewing the bullish and bearish trend reversal patterns, we also encounter continuation patterns, which, as their name suggests, each pattern presents its variations.
Doji and its Variants
The Doji is a continuation pattern that indicates price neutrality. This pattern shows a very small or nearly nonexistent candle body, indicating that the opening and closing prices are equal or very similar and also present with long lower and upper wicks.
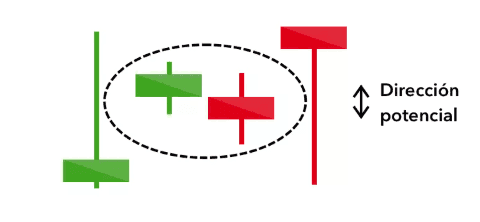
This candle, resembling a cross, can appear in markets with both upward and downward trends. Thus, it is useful to be attentive to the upcoming market changes after what is considered a period of uncertainty.
Other relevant continuation candle patterns include Bullish and Bearish Harami, and the Three Ascending and Descending Methods.
How to Interpret Candlestick Patterns
The interpretation of candlestick patterns is as simple as recognizing the characteristics presented by the real body of the candle and its shadows over a period of time.
Reading Wicks and Bodies
The body of the candle is defined by the opening and closing price of an asset, and as a rule of thumb, it can be seen in green or red colors, depending on whether the trend is bullish or bearish.
Regarding the wicks, also known as shadows, they indicate rises and falls.
Measuring Signal Strength
Japanese candlesticks allow a significantly accurate interpretation of market volatility, direction, inclination, and price movement at a given moment.
The size of the candle body, the length of the lower and upper wick, and the candle color are the major indicators that provide the signals needed to make financial decisions over a range of time.
Combining with Other Indicators
This is a tool that graphically provides signals with a high degree of accuracy; however, in moments of uncertainty or in a market with neutrality between opening and closing, it is common to combine it with other indicators, such as moving averages and oscillators, among others.
In some cases, combining basic candlestick patterns with more complex patterns can be helpful.
Trading Strategies with Candlestick Patterns
Thanks to candlestick patterns, it is possible to make more accurate financial decisions and plan more successful trading strategies.
Real-Time Pattern Identification
With the ease of observing and predicting market changes with real-time candlestick patterns, you can identify and visualize upward or downward price trends and anticipate to make the most convenient decision.
Risk Management
In the trading area, it is essential to ensure the profitability of investments, which makes good risk management indispensable.
Analyzing short-line candlestick patterns allows obtaining precise data on the market situation over a short period to predict price changes and potential risks.
Signal Validation
Signal validation in candlestick patterns is fundamental in technical analysis, so once trends are identified and influential factors at that moment are recognized, it is very helpful to rely on other indicators to validate all the information.


