
Have you ever noticed those patterns that look like funnels on the charts? Let's dive into the fascinating world of wedges in trading, a tool that can offer intriguing clues about upcoming market moves.
What are Wedge Patterns?
Wedges are like those moments when the price seems to be squeezed between two converging lines. Imagine squeezing a tube of toothpaste – pressure builds until something inevitably has to give.
Main Features
Convergence of trend lines
Typical duration of 1 to 3 months
Volume tends to decrease during its formation
Clear breakout once the pattern is complete
Key Elements of a Wedge
Two trend lines coming together
General direction of movement
Decreasing volume
Defined breakout point
Types of Wedges
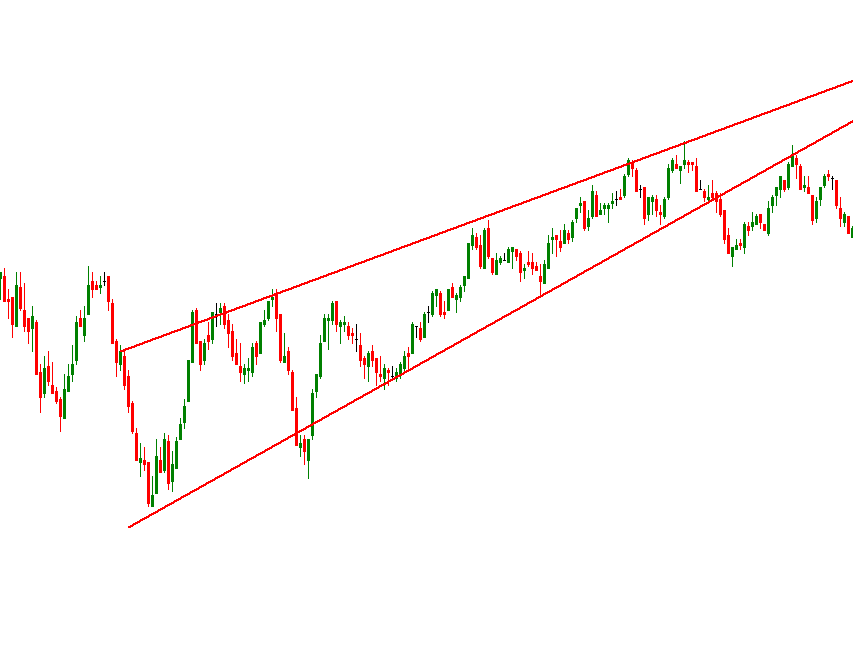
Rising Wedge
Think of a narrowing ramp as it climbs. The price rises but with decreasing strength, like a runner getting tired on an uphill slope.
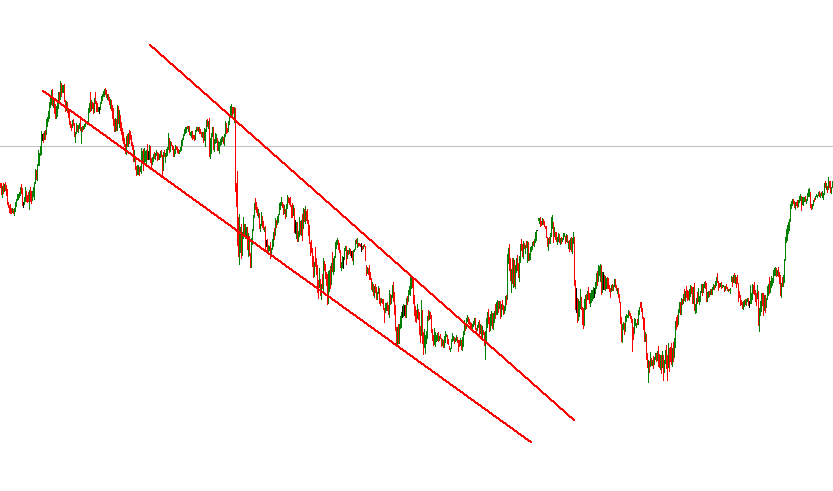
Descending Wedge
It's like a slide that narrows. The price falls, but sellers gradually lose momentum.
Differences Between Rising and Descending Wedges
Direction of movement
Opposite exhaustion signals
Different target prices
Specific volume behavior
Identifying Wedge Patterns
How to Recognize a Wedge on the Chart
Observe the convergence of the lines
Look for at least 3 contact points on each line
Confirm the previous trend
Analyze volume behavior
Characteristics of a Valid Wedge
Proper angle of convergence
Minimum formation duration
Adherence to trend lines
Volume consistent with the pattern
Common Mistakes in Identification
Confusing with triangles
Not waiting for confirmation
Ignoring market context
Rushing into entry
Trading with Wedges
Strategies for Rising Wedges
Wait for the breakout of the lower line
Confirm with volume
Set a stop loss above the last resistance
Define realistic price targets
Strategies for Descending Wedges
Wait for the bullish breakout
Verify the increase in volume
Set stop loss below the last support
Project targets based on the pattern's size
Risk Management in Wedge Trades
Minimum risk/reward ratio of 1:2
Use of dynamic stops
Position size adjusted
Defined exit plan
Relation with Other Patterns
Triangles vs. Wedges
Wedges have a clear tilt, while triangles are usually more symmetrical.
Continuation and Reversal Patterns
Wedges can act as both, depending on the context and their formation.
Wedges in Different Timeframes
Their reliability varies depending on the timeframe, being more relevant in longer periods.
Frequently Asked Questions
Why is a Rising Wedge Bearish?
It shows a gradual depletion of buyers despite the upward movement.
Why is a Descending Wedge Bullish?
It indicates that sellers are losing strength, setting the stage for a rebound.
Reliability of Wedge Patterns
The effectiveness is around 60-70%, increasing with volume confirmation and favorable context.
Are you ready to identify wedges on your charts? Remember that practice makes perfect, and each pattern is an opportunity to learn something new about the market.


